“Mr President, your shining city on the hill is more a tale of two cities”, exclaimed then-New York Governor Mario Cuomo as he delivered one of the most memorable criticisms of Ronald Reagan’s tax policies at the 1984 Democratic Party Convention in the United States. Whether one calls it ‘trickle-down’, Thatcherism or Reaganomics, tax cuts to top income earners have remained one of the most divisive topics of contemporary politics and economics with deep ramifications to the organisation of social structures.
One of the most widely studied topics of economics, trickle-down economics, refers to the reduction of financial obligations of corporations and the wealthiest individuals in society to the government (Ketchell, 2011). It consists of reducing taxes through lowering marginal tax rates for top-income earners and restructuring certain tax breaks. Presuming that these wealthy owners of capital are best placed to allocate resources, the newly created tax savings would, in theory, be reinvested in the economy, as opposed to being inefficiently filtered through government bureaucracy, stimulating job creation and broadening economic prosperity to the middle class and the proletariat.
However, the robustness of this theory rests on two notoriously controversial assumptions; that a reduction to the marginal tax rates of the wealthy will boost individual consumption, and that the resultant economic growth from the wealth filtering down to the working class will pay for the fiscal burden of tax cuts. However, critics point to empirical evidence that tax cuts have not consistently resulted in increased consumption, and that new tax savings are often reinvested in (relatively unproductive) financial markets rather than goods markets.
However, the central charge against trickle-down is the glaring changes to the distribution of wealth, in favour of the wealthy, which has been evident in economic data; many western economies that made immense strides in the equitable distribution of wealth in the three decades post-second world war experienced a dramatic worsening of inequality following the introduction of trickle-down policies in the 1980s. Indeed, in 2013, an ardent critic of the post-Reagan tax structure, then President Obama, condemned the economic theory as a threat to society and the concepts of liberalism governing the economic policies of Western countries (The White House Archives, 2013).
Ronald Reagan was a pioneer for this type of policy, and he did not hold back. In 1981, less than a year after being elected President, he signed a uniform cut of personal income tax rates across all brackets, including cutting the top marginal income tax rate from 70% to 50%, combined with reductions in the capital gains tax rate. This package failed to deliver Reagan’s desired results of greater tax revenue, lower fiscal deficit and economic growth. In fact, it achieved pretty much the opposite. In a paper produced by a career US Treasury staffer in 2006 (during the administration of George W. Bush, who himself presided over significant tax cuts), it was found that the cuts reduced tax revenue by 18.6% by its fourth year (Tempalski, 2006). The budget deficit correspondingly rose from 2.3% of the Gross National Product in 1980 to 6.3% of the GNP in 1983 (Frankel, 2017). The distribution of taxes paid across income levels became increasingly less progressive (Toder et al., 1986). In general, taxes increased at a greater rate for lower-income earners than higher-income earners, with those in the lowest bracket seeing their share of total taxes paid rise in this period (Toder et al., 1986). Although those in the top bracket paid a slightly greater share of income tax in 1983 compared to 1980, it was largely due to greater growth in their before-tax income compared to those in the lower brackets (Toder et al., 1986). A different measure tells the same story – the lower half of earners saw their real after-tax income per capita decrease, while the top half saw theirs increase (Toder et al., 1986).
The tax cut also did not stop a recession that had been brewing over the past year. The stagflation in the late 1970s led the newly appointed Chairman of the Federal Reserve, Paul Volcker, to aggressively raise interest rates in an attempt to bring down inflation. As a result, the economy plunged into a recession in early 1980, and although it appeared to be recovering by late 1980, unemployment and inflation remained high, and the concern that the apparent recovery was just a respite soon came true. This was the most unpopular point of Reagan’s Presidency, and his economic advisors realised that taxes will need to be raised to curb the increasing deficit (Prasad, 2012). In 1982, just a year after enacting the tax cuts, Reagan signed a bill that some have described as the biggest tax hike in the post-war era (Frankel, 2017). Notably, however, it did not affect the top marginal personal income tax rate, but rather mostly increased corporate tax rates (Frankel, 2017).
However, receding inflation due to the easing of supply constraints, placed the economy in rapid recovery, helping Reagan to cruise to re-election in 1984. In 1986, he made a second attempt at cutting personal income tax. It produced a very different package from the one in 1981. After a bipartisan process, the final bill was intended to be revenue-neutral. It was most well-known for cutting the top rate from 50% down to just 28%, but it also reduced the number of tax brackets – effectively to just two – and expanded deductions and tax credits aimed at working families and low-income groups (Frankel, 2017). To offset the cuts, the capital gains tax was raised and a range of deductions was eliminated, especially corporate-related ones (Frankel, 2017). Because of this whole suite of changes, the effects of this second attempt are far more ambiguous to dissect.
The economic theory behind these tax cuts remains murky, with even supporters and former Reagan officials offering different opinions. In fact, Reagan himself offered two contradictory explanations for the motivation behind the tax cuts, all within two sentences in his autobiography (Prasad, 2012). One centred on the Laffer curve, a concept now mostly disregarded by economists, suggesting that lower tax rates would result in higher tax revenues (The Economist, 2019). The other explanation, the so-called “starve the beast”, suggested that tax cuts would lead to less revenue, creating pressure on the government to cut spending, decrease the deficit, and reduce inflationary pressure on the high-inflation economy at the time (Prasad, 2012). Some former administration officials have claimed that none of Reagan’s economic advisors actually believed the tax cuts would increase revenue, and cited the administration’s own projections from time which showed revenue decreasing as a percentage of GNP (Bartlett, 2011). Nevertheless, that explanation was cited by Reagan officials at the time and continues to be used by Republicans when advocating for tax cuts (Prasad, 2012). In any case, the second explanation was also thoroughly disproven, with the deficit ballooning under the Reagan administration (Roubini, 1997).
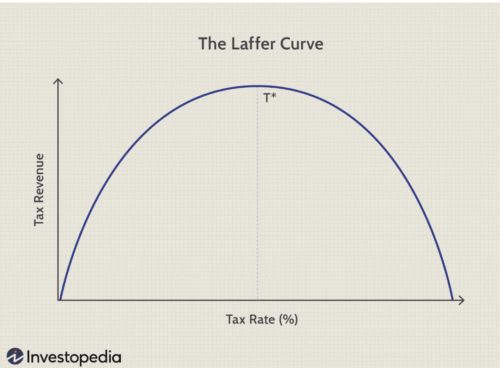
The Laffer curve, developed by supply-side economist Arthur Laffer, suggested the government may need to reduce the tax rate to maximise tax revenue
As with the economic theory, the economic impact is difficult to dissect. One major controversy lies in the ultimate effect of the tax cuts on inflation. When Reagan first proposed his tax cuts in 1981, most mainstream economists warned that it would create huge inflationary pressure (Prasad, 2012). As it happened, the recession which immediately followed the tax cut prevented the effect from being seen. Nevertheless, supporters have claimed the tax cuts were integral to lowering inflation, downplaying the role of Paul Volcker and the Federal Reserve (Niskanen & Moore, 1996). The role of the tax cuts in the economic expansion of Reagan’s Presidency is similarly nebulous, with detractors arguing that it was the natural path of an economy recovering from a recession with low inflation and high unemployment (Roubini, 1997). Paul Krugman pointed out that Reagan actually presided over heavy government spending, as evidenced by the increasing deficits over the period, making economic growth a classic case of Keynesian stimulus theories (Krugman, 2012).
The final issue, and the issue most commonly cited by critics of Reagan, is the effect of the tax cuts on increasing inequality. While Reagan’s supporters would disagree, most studies are in agreement about its negative effects. Some contend that the growing inequality was already appearing before Reagan took office, but nevertheless comes to the conclusion that Reagan’s policies exacerbated the issue (Plotnick, 1992). These studies also concluded that reducing the top tax rate has no effect on economic growth, employment, savings, investment or productivity (Hungerford, 2012).
Even now, Reaganomics continues to have an impact on public policy, despite historical empirical evidence and numerous studies that cast doubt on its effectiveness. Trump’s Tax Reform Plan, which was seen as a lopsided victory for the wealthy, banks and other corporations (Floyd, 2022), is one of the more well-known examples. Another is Truss and Kwarteng’s tax cuts for Britain’s top earners which received significant backlash to the extent of forcing them into an embarrassing U-turn (Crerar, 2022).
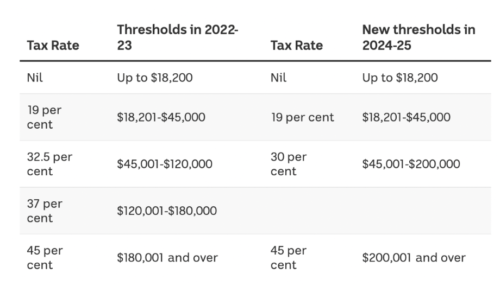
Australia’s Albanese Labour Government is currently considering moving ahead with Stage 3 of tax cuts legislated in 2020 by the previous Liberal government, following Stages 1 and 2 which have already been implemented. Commencing on July 1, 2024, Stage 3 creates a 30 per cent flat tax rate for all Australians with an income between $45,000 and $200,000 (Maiden, 2022). The tax cuts will therefore abolish the current 37 per cent tax bracket, lower the existing 32.5 per cent bracket to 30 per cent, and raise the threshold for the top tax bracket from $180,001 to $200,001 (Janda & Hutchens, 2022) – as summarised in the table below. It will supposedly ease living costs for Australians by increasing the low-and-middle-income tax offset by $420, boosting economic growth by increasing savings and investment and reducing unemployment. Given the effect tax cuts have on wealth distribution, what impact will this public policy have on the existing levels of inequality in Australia has been the subject of much debate.
The impact of proposed tax cuts on inequality in Australia
Inequality is frequently measured by the Gini index, an internationally accepted standard with coefficients that range from 0 to 1 – with 0 representing perfect equality and 1 representing perfect inequality (ABS, 2020). The latest reported Gini index by the Australian Bureau of Statistics (ABS) is a coefficient of 0.324 for equivalised disposable household income and 0.436 for gross household income in 2020, suggesting relatively low levels of inequality (2022). However, to put this into perspective, a report by UNSW Sydney and the Australian Council of Social Services (ACOSS) Poverty and Inequality Partnership found that household wealth in Australia is still very unequally divided, where the highest 10 per cent of households have an average wealth of $6.1 million (46 per cent of total wealth), the next 30 per cent has an average of $1.7 million (38 per cent of total wealth), and the majority has an average of $376,000 (17 per cent of total wealth). According to this report, wealth inequality rose significantly from 2003 to 2008, then declined slightly during the pandemic due to rising house prices, which moderated overall wealth inequality.
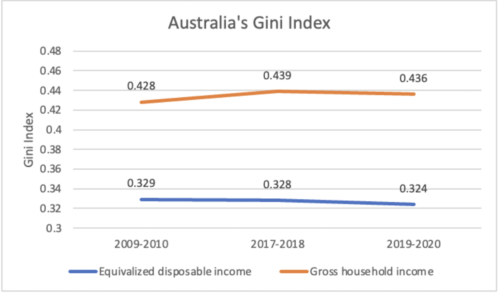
Australia’s Gini Index seems to consistently be in the lower range of inequality levels.
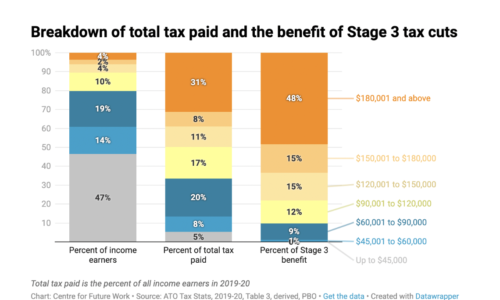
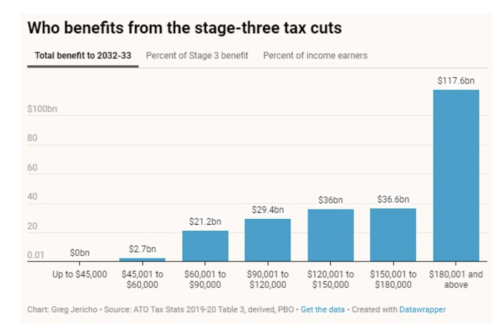
Considering Australia’s inequality levels, tax cuts on the wealthy will merely deepen the gap between rich and poor, making the Australian tax system less progressive than it has been at any point since the 1950s – a standard that is far below the average of OECD countries (Janda and Hutchens, 2022). An independent study by the Parliamentary Budget Office (PBO), commissioned by the Greens and released by Bandt’s office, has found that the Stage 3 tax cuts will disproportionately favour the wealthy, as seen in the two charts below. The PBO estimates that the tax cuts will cost $243.5 billion that will be carried out to 2032-2033, where 6% will go to the richest 1% of income earners and 77% to the richest 25% (Jericho, 2022). The PBO found that people earning $180,000 would enjoy $117.6 billion in lower taxes, compared to the minuscule $2.7 billion for those who earn under $60,000 (Butler, 2022). By 2033, the top 22% of earners would get nearly $188 billion in benefits, which is more than 77% of the total package.
A poll by the Australia Institute sheds light on the public’s disapproval of the Stage 3 tax cuts, where more than twice as many Australians support Labour scrapping the reform plan. The survey with a sample of 1409 Australians found that 41 per cent support repealing the tax cuts, 22 per cent oppose, and 37 per cent are unsure (Masters, 2022). When asked which is better for Australia’s long-term interests, 60 per cent of Australians chose increased spending on government services like health and education, while only 15 per cent chose to proceed with the stage 3 tax cuts – with the other 15 per cent choosing increased defence spending (The Australia Institute, 2022).
In spite of public sentiment, Prime Minister Anthony Albanese has persistently vowed to push on with the tax cuts to avoid breaking an election promise – evidently a highly political move. The poll, however, reveals that 61 per cent of Australians deem a proper evaluation of the efficacy of this policy to be more important than keeping an election promise (The Australia Institute, 2022), suggesting the public’s relative support of a U-Turn similar to that of the UK’s.
In the wake of the COVID-induced financial crisis, a tax policy that is both fair and growth-stimulating is needed to drive economic recovery. The aftermath of the pandemic raises a challenge, as higher taxes for wealthy individuals can be seen as harmful to growth even though they are deemed to be equitable. In general, empirical evidence suggests that tax cuts are justified to the extent that they are centred on lower to middle-income levels who need the most tax relief. Indeed, unlike in the case of tax cuts to top income brackets, mounting evidence suggests that personal income tax cuts targeted at those on modest incomes can increase their disposable income, incentivise them to work, and improve their living standards (Arnold et al., 2011). Additionally, increased public support for employment-focused programs such as vocational training schemes is seen as more conducive to achieving equity whilst simultaneously stimulating the economy – programs that may not be feasible if revenue is reduced due to wide-scale tax cuts.
References
Arnold, J. M., Brys, B., Heady, C., Johansson, Å., Schwellnus, C., & Vartia, L. (2011). Tax Policy for Economic Recovery and Growth. The Economic Journal, 121(550), F59–F80. https://doi.org/10.1111/j.1468-0297.2010.02415.x
Australian Bureau of Statistics. (2022, April 28). Summary Indicators of Income and Wealth Distribution. Australian Bureau of Statistics; Australian Bureau of Statistics. https://www.abs.gov.au/statistics/detailed-methodology-information/concepts-sources-methods/survey-income-and-housing-user-guide-australia/2019-20/summary-indicators-income-and-wealth-distribution
Bartlett, B. (2011, August 8). The 1981 Tax Cut After 30 Years: What Happened to Revenues? Tax Notes, 627–629.
Butler, J. (2022, August 29). Stage-three tax cuts: richest 1% of Australians will save as much as poorest 65% combined, analysis shows. The Guardian; The Guardian. https://www.theguardian.com/australia-news/2022/aug/29/stage-three-tax-cuts-richest-1-of-australians-will-save-as-much-as-poorest-65-combined-analysis-shows
Crerar, P. (2022, October 3). Night of the hurried U-turn: how Truss and Kwarteng dumped their tax cut. The Guardian. https://www.theguardian.com/global/2022/oct/03/night-of-the-hurried-u-turn-how-truss-and-kwarteng-dumped-their-tax-cut
Floyd, D. (2019, April 30). Trump’s Tax Reform Plan Explained. Investopedia. https://www.investopedia.com/taxes/trumps-tax-reform-plan-explained/
Frankel, J. (2017, December 4). How the GOP tax overhaul compares to the Reagan-era tax bills. PBS NewsHour. https://www.pbs.org/newshour/economy/making-sense/how-the-gop-tax-overhaul-compares-to-the-reagan-era-tax-bills
Hungerford, T. L. (2012). Taxes and the Economy: An Economic Analysis of the Top Tax Rates Since 1945 (CRS Report for Congress No. R42729). Congressional Research Service. https://www.democrats.senate.gov//files/documents/CRSTaxesandtheEconomy%20Top%20Rates.pdf
Janda, M., & Hutchens, G. (2022, October 5). What are the stage 3 tax cuts? Why won’t they fix bracket creep? – ABC News. ABC News. https://www.abc.net.au/news/2022-10-06/stage-three-tax-cuts-wont-fix-bracket-creep/101503456
Jericho, G. (2022, August 31). 48% of the benefit of Stage 3 tax cuts go to the richest 4%. The Australia Institute. https://australiainstitute.org.au/post/new-data-shows-how-the-stage-3-tax-cuts-massively-favour-the-wealthy/
Krugman, P. (2012, June 8). Opinion | Reagan Was a Keynesian. The New York Times. https://www.nytimes.com/2012/06/08/opinion/krugman-reagan-was-a-keynesian.html
Maiden, S. (2022, August 30). Graph exposes biggest losers in tax cuts. News; news.com.au — Australia’s leading news site. https://www.news.com.au/finance/money/tax/men-earning-over-180000-the-big-winners-from-stage-3-tax-cuts/news-story/42e71004b408315a2e4badc7f41c7ac2
Masters, R. (2022, October 3). Stage 3 tax cuts: Majority of Australians want sound economics over “keeping election promises”, poll reveals. @9News; 9News. https://www.9news.com.au/national/stage-3-tax-cuts-poll-shows-majority-of-australians-want-sound-economics-over-keeping-election-promises-politics-news/a3bf09b8-6ee3-4d52-88a5-99fb86b93cce
Niskanen, W. A., & Moore, S. (1996). Cato Institute Policy Analysis No. 261: Supply-Side Tax Cuts and the Truth about the Reagan Economic Record. Cato Institute. https://www.academia.edu/download/55307890/Policy_Analysis.pdf
Plotnick, R. D. (1992). Changes in Poverty, Income Inequality and the Standard of Living during the Reagan Years. Journal of Sociology and Social Welfare, 19(1), 29.
Polling – Stage 3 income tax cuts – The Australia Institute. (2022, September 30). The Australia Institute. https://australiainstitute.org.au/report/polling-stage-3-income-tax-cuts/
Prasad, M. (2012). The Popular Origins of Neoliberalism in the Reagan Tax Cut of 1981. Journal of Policy History, 24(3), 351–383. https://doi.org/10.1017/S0898030612000103
Roubini, N. (1997). Supply Side Economics: Do Tax Rate Cuts Increase Growth and Revenues and Reduce Budget Deficits? Or Is It Voodoo Economics All Over Again? Stern School of Business. https://pages.stern.nyu.edu/~nroubini/SUPPLY.HTM
UNSW Sydney. (2022, July 21). Wealth inequality in Australia and the rapid rise in house prices. UNSW Newsroom. https://newsroom.unsw.edu.au/news/social-affairs/new-report-wealth-inequality-australia-and-rapid-rise-house-prices#:~:text=Household%20wealth%20inequality,million%20or%2038%20per%20cent.
Tempalski, J. (2006). Revenue Effects of Major Tax Bills (OTA Working Paper No. 81; OTA Papers). US Department of the Treasury. https://home.treasury.gov/system/files/131/WP-81.pdf
The Economist. (2019, June 19). Can countries lower taxes and raise revenues? The Economist. https://www.economist.com/graphic-detail/2019/06/19/can-countries-lower-taxes-and-raise-revenues
Toder, E., Nielsen, R., & Sammartino, F. (1986). Effects Of The 1981 Tax Act On The Distribution Of Income And Taxes Paid [Staff Working Paper]. Congressional Budget Office. https://www.cbo.gov/sites/default/files/99th-congress-1985-1986/reports/doc20a-entire.pdf
Images:
https://www.abs.gov.au/statistics/economy/finance/household-income-and-wealth-australia/latest-release
https://australiainstitute.org.au/post/new-data-shows-how-the-stage-3-tax-cuts
https://www.futurework.org.au/the_pbo_reveals_just_how_much_the_stage_3_tax_cuts_favour_the_wealthy
The CAINZ Digest is published by CAINZ, a student society affiliated with the Faculty of Business at the University of Melbourne. Opinions published are not necessarily those of the publishers, printers or editors. CAINZ and the University of Melbourne do not accept any responsibility for the accuracy of information contained in the publication.
